Tuesday, May 4, 2010

Sabrmetrics vs. Characteristics


In my mind, there are two domains in the world baseball: the physical act of playing the game and the attempt to quantify every single aspect of it, through mathematics and statistics. Sabermetrics transforms general data into obscure statistics as it tries to numerically measure the success of a ballplayer by creating a common field of numbers that relates each player to one another; however, a piece of information not yet shown by Sabermetrics is the aspect of individuality and characteristics that each teammate brings to his ballclub.

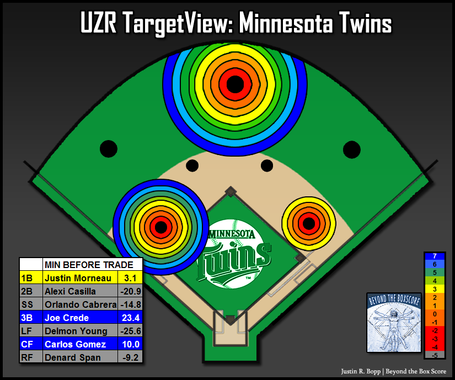
Sabermetrics is an extremely valuable tool to everyone from Brian Cashman, the General Manager of the Yankees, and to die hard fantasy baseball fanatics everywhere. Today’s statistics are not limited merely to Batting Average and Home Runs, but have grown to calculate the WAR (Wins Above Replacement) of a player, and even UZR-150, the defensive range of a player in the field.
While these statistics are great for determining the overall success of a ballplayer, the behind the scenes attributes which these players express are of equal importance. If a player hits 40 homeruns in a single season at the college level, he will be drafted by a Major League team; however this is when baseball becomes not just about statistical performance but what qualities a player contributes to his team.
A baseball player must exhibit tenacity, toughness, discipline, and work ethic if he wants to survive in the Bigs. These attributes are the fuel behind the world of statistics and determine the level at which a player performs. Take two completely different players: Milton Bradley of the Seattle Mariners and Chris Carpenter of the St. Louis Cardinals. Both players reside at different poles of the leadership world and resultingly the world of statistic success as well.
Bradley is most well known for his brash actions and his recent streak of poor performance. Over the past few years there have been so many Bradley related incidents that it is no longer possible to count them with your fingers. Just this past month, only the second week of the season, rabbit-eared Milton Bradley was caught flipping the bird to the fans who were taunting him (I wonder why…), and before this incident he had issued this quote:
It’s no wonder that Bradley’s unacceptable actions have translated to poor performance in 2010. He is hitting just .224 with 22 strikeouts this season.


Chris Carpenter is a completely different story. Just like Bradley, his actions have translated to his performance on the field… only Carpenter has had just the opposite effect as Bradley. The Redbird Ace not only leads the team when he is on the mound, but provides leadership for all the pitchers on the Cardinals staff during non-start days. Take Carp’s last against the Reds. It is apparent that Chris Carpenter has not been his normal self this season, but on Sunday he showed why it is not the “stuff” which proves the success of a player, but rather the mental toughness that goes into producing that “stuff.”
“I just try to continue to go out and give my team a chance to win. With the defense and offense we have playing behind me, you're going to win a lot of ballgames.” – Chris Carpenter
Carpenter is currently a perfect 4-0 and has been a great role model to Adam Wainwright over the past few years and the emerging Jaime Garcia.
Check out Dan Agonistes at:
 http://danagonistes.blogspot.com/2005/01/scouting-vs-sabermetrics.html


Milton Bradley is even dumber than this guy  /|\

Sunday, March 28, 2010

StL Cardinals 2004, 2006, 2010 Comparison: Pitching (2 of 2)

Year – Rk. Name: W-L --- ERA
(stats for 2010 are from the 2009 season)

Starting Pitching Rotation –
2004 – 1. Matt Morris: 15-10 --- 4.72
2. Jason Marquis: 15-7 --- 3.71
3. Woody Williams: 11-8 --- 4.18
4. Jeff Suppan: 16-9 --- 4.16
5. Chris Carpenter: 15-5 --- 3.46
- The Cardinals’ rotation in 2004 was an interesting one which had a win column fueled by superior run production on offense. Although the ERA of the rotation was not impressive by any means, the fact that the Cards’ offense led the national league in runs scored and was 104 runs over the league average allowed every single pitcher to obtain double digits in the win column. 4 out of the five starters had at least 15 wins and Matt Morris was the only one with double digits in the losses column.
2006 – 1. Chris Carpenter: 15-6 --- 3.09
2. Jason Marquis: 14-16 --- 6.02
3. Jeff Suppan: 12-7 --- 4.12
4. Mark Mulder: 6-7 --- 7.14
5. Anthony Reyes: 5-8 --- 5.06
6. Jeff Weaver: 5-4 --- 5.18
- 2006 was supposed to be a big year for the Cardinals in terms of pitching: Cy Young Winner Carpenter was coming off a 21 win season, Jason Marquis was hoping to regain his level of consistency from 2004, Suppan was also expected to perform somewhere around his previous level in 2004, Mulder was a big acquisition from the A’s that was supposed to make the rotation unstoppable, and everybody in St. Louis had high hopes for the youngster Reyes. The offense didn’t help the situation either and the 2006 Cardinals were unable to perform at the expected level.
2010 – 1. Chris Carpenter: 17-4 --- 2.24
2. Adam Wainwright: 19-8 --- 2.63
3. Brad Penny: 11-9 --- 4.88
4. Kyle Lohse: 6-10 --- 4.74
5. Jaime Garcia (Spring Training): 0-0 --- 1.42
- Carpenter is looking to lead the team with his first fully healthy season in 4 years. Wainwright is battling with Carpenter for the first spot in the rotation and will be a 1-2 punch of two ace pitchers in a row. Brad Penny is an interesting work in progress for Dave Duncan, and will hopefully return to his work-horse form from LA. Lohse is also hoping to bounce back from 2009 and prove that he is worth his $9.188 million dollar contract. On his second to last Spring Training start, "Lohse was efficient enough that he needed to throw 12 pitches in the bullpen to get to his scheduled pitch count of 60." His start against the Nationals was a different story... Jaime Garcia is trying to fight to keep the 5th spot in the rotation, but "the decision has in fact not yet been made." There are high expectations for this rotation, but even higher potential.
Verdict: 2010
- If they are able to fulfill their potential, the 2010 Cardinals’ rotation could be the best in the major leagues. However, if there is any way that the offense does not support them or injuries plague the rotation, then 2004 will win the contest.

Relief Pitching –
2004 – Dan Haren, Kiko Calero, Cal Eldred, Julian Tavarez, Ray King, Steve Kline
- 2.96 ERA --- 1.146 WHIP --- 335 IP
- The 2004 bullpen was an effective bullpen led by Steve Kline who posted a 1.79 ERA and Julian Tavarez with a 2.38 ERA. They posted the lowest ERA and the lowest WHIP out of all three teams and helped secure the wins for many of the starters.
2006 – Josh Hancock, Adam Wainwright, Braden Looper, Randy Flores, Sydney Ponson, Brad Thompson
- 4.06 ERA --- 1.363 WHIP --- 392.3 IP
- When a team’s bullpen posts an ERA over 4, they will hardly ever situate themselves to win. This is was part of the failure for the 2006 team. However, part of the story can be summed up by the fact that the bullpen accumulated 392.3 innings pitched over the entire season. The fact that they were needed that much shows not only the ineffectiveness of the starters, but also the overuse of the relievers.
2010 – Jason Motte, Kyle McClellan, Dennys Reyes, Trever Miller, Mitchell Boggs, Blake Hawksworth
- 3.41 --- 1.359 WHIP --- 306 IP
- Like the rest of the parts of the team, if the relievers live up to their potential, they will do well. The stats leave room for improvement, but because the relievers are from last year’s team, they know how the system works and are familiar with Dave Duncan’s pitching philosophy. This bullpen consists of experienced lefthanders, young kids striving to prove themselves, a live arm in Jason Motte (though his mechanics need work), and a competitive contender for the 5th starter role.
Verdict: 2004
- The 2004 bullpen was spectacular and their ability to hold games made way for Jason Isringhausen to close games and create wins. The 2010 relievers will do fine when it comes to contributing to the wins, but their average (possibly above average) performance will not be able to match the superiority of the 2004 bullpen.

Closer –
2004 – Jason Isringhausen: 47/54 --- 2.87
- Jason’s best year by far, where he led the majors with 47 saves and posted a strong 2.87 ERA. 47 out of the teams close wins were closed out by him, and he made it possible for the team to make an appearance in the World Series.
2006 – Jason Isringhausen: 33/43 --- 3.55
- Izzy made everyone watching bite their nails with anxiety whenever he went out to pitch in 2006. A 3.55 ERA makes it hard for a closer to be as effective as necessary, and his save to opportunity ratio shows just that.
2010 – Ryan Franklin: 38/43 --- 1.92
- Franklin rose to the occasion and started the year off a hundred times better than anyone could’ve expected. His astounding 1.92 ERA shows his mastery of every pitch in his repertoire, and he was able to keep his closer role for most of the season. Although at the end of the season he was rocky at times, if he learns from that in the 2010 season, his contribution to the team could save the bullpen and allow for a 90+ win season.
Verdict: 2004
- It doesn’t get much better than Isringhausen in 2004, and his immense number of saves says it all. I do not see Franklin getting much more than 40 saves, but just like the other parts of the 2010 team, if he performs at the top of his game like he did most of 2009, the 2010 Cardinals have a great chance to win big.

 Apples or Oranges Comparison - http://www.flickr.com/photos/26176646@N04/2492945625/

Monday, February 15, 2010

StL Cardinals 2004, 2006, 2010 Comparison: Hitting (1 of 2)


Why didn't the 2004 team win the World Series? Why did the 2006 team win the World Series? Where does the 2010 team stand in the race this year? I'm going to help you make sense of it all, starting with Offensive.

            Year – Hitter: BA --- HR --- RBI --- OBP --- WAR
                        (stats for 2010 are from the 2009 season)
Catcher
2004 – Mike Matheny: .247 --- 5 --- 50 --- .292 --- 0.4
-          Although he was never an offensive powerhouse, Matheny posted decent numbers for a catcher, but was most known and highly thought of for his outstanding defensive performance behind the plate.
            2006 – Yadier Molina: .216 --- 6 --- 49 --- .274 --- -0.2
-          Molina’s second year with the starting catching job in StL led to a below par offensive season for the young catcher. Outside of his defensive effectiveness wearing the tools of ignorance, perhaps his most notable contribution to the Card’s World Series win in 2006 was his clutch 2-run homer against the Mets in game 7 of the NLCS.
            2010 – Yadier Molina: .293 --- 6 --- 54 --- .366 --- 3.4
-          Yadi has proved himself as one of the best defensive catchers in the game, posting a caught stealing percentage of 41%. Not only were his defensive stats impressive (as always), but his offensive stats received a large boost from 2006. Molina’s inside out swing and his ability to hit the ball to the opposite field make him a very valuable part of the Cardinal’s lineup.
Verdict: 2010
-          Matheny and Yadi both make tremendous defensive catchers, but the upper hand goes to Molina with his superior offensive performance.
1st Base –
            2004 – Albert Pujols: .331 --- 46 ---123 --- .415 --- 7.9
            2006 – Albert Pujols: .331 --- 49 --- 137 --- .431 --- 7.7
            2010 – Albert Pujols: .327 --- 47 --- 135 --- .443 --- 8.4
-          … Not much to say here, except for Albert just being Albert.
2nd Base –
            2004 – Tony Womack: .307 --- 5 --- 38 --- .349 --- 2.8
-          Womack’s year in 2004 marks the second year of the Cardinal’s trend in picking up cheap, temporary, disposable second basemen. No one expected Womack to perform the way he did in 2004, setting his career high in batting average a full .025 points above his previous mark. His 26 stolen bases cannot go unnoticed either. With that said, Womack proved to be not a spot-filler in the lineup, but went on to have a clutch and career year with the Redbirds in 2004.
            2006 – Aaron Miles: .263 --- 2 --- 30 --- .324 --- 0.2
-          Miles turned out to be just another cheap second baseman for the Cardinals and did not play a huge role in the 2006 World Series.
            2010 – Skip Schumaker: .303 --- 4 --- 35 --- .364 --- 1.2
-          A vast improvement for second basemen in recent years, Skip Schumaker represents the first potential non-disposable, permanent second baseman in six years (he just signed on with the Card’s for 2 more years). Skip’s transition from OF to 2B is an intriguing and extremely important move for the Cardinals: it puts Skip at a position for which he is more physically and offensively suited, turns a previously wasted position into a key role for the team, frees up an OF spot for a boost to the lineup, improves team chemistry, and creates a harmonious alternative where the Cardinals are able to better utilize an important part of their foundation.
Verdict: 2004
-          If you take into account Womack’s and Skip’s comparable stats, WAR, Tony’s larger number of stolen bases and better fielding, and Schumaker’s longevity as a Cardinal and lack learning curve at 2nd base, Womack barely legs out Schumaker for the more impacting 2nd baseman.
3rd Base –
            2004 – Scott Rolen: .314 --- 34 --- 124 --- .409 --- 8.8
-          Acquired from the Phillies in 2002, Rolen posted the highest WAR of his career in 2004 (8.8 is a HUGE WAR), and his stats were so impressive that, along with Pujols and Edmonds, they earned the nickname of MV3.
            2006 – Scott Rolen: .296 --- 22 --- 95 --- .369 --- 5.7
-          Suffering from past shoulder injuries and rocky relations with manager Tony La Russa, Rolen’s stats fell with his health. Although he managed to hit just under .300 and put up a 5.7 WAR, and continued to be an integral part of a weaker Cardinals team in 2006, Rolen would never be the same ballplayer again.
            2010 – David Freese: .269 --- 12 --- 53 --- .335 --- 1.8 (2010 CHONE Projections)
-          Freese will be nowhere near Rolen’s stats in 2010, seeing as he is just walking on to the Major League stage as the probable starter at 3rd base for the Cards ("GM John Mozeliak insisted that David Freese would receive the first chance to stake a claim to third base" - Joe Strauss); CHONE projections are often lower than reality, however, and it is possible that Freese could have a solid rookie year at third base. After all, you have to let the kid start somewhere.
Verdict: 2004
-          Scott Rolen’s 2004 career year and World Series appearance easily wins this debate; however, don’t rule Freese out as being a contributor to a strong Cardinal’s season in 2010.
Shortstop -
2004 – Edgar Renteria: .287 --- 10 --- 82 --- .327 --- 1.9
-          2004 was not Renteria’s best year. For one thing, his WAR was 4.9 losses below 2003; however, he helped to bring the team to the World Series, and was not at all a hindrance the team’s performance.
            2006 – David Eckstein: .292 --- 2 --- 23 --- .350 --- 1.5
-          The Cardinals went in a completely different direction with Eckstein, switching from a powerful, middle of the lineup shortstop, to a scrappier, 2nd-baseman turned SS in David Eckstein. 2006 was not as productive as 2005 for the King of Hustle, but he went on to become the MVP of the 2006 World Series.
            2010 – Brendan Ryan: .292. --- 3 --- 37 --- .340 --- 3.2
-          Ryan is another intriguing figure in the St. Louis organization. In 2009 he proved that he could play good defense, and that his bat would help the team as well. La Russa often used him as the ninth hitter in the lineup in order to create a dual-leadoff approach. He is not projected to have as productive as a season as in 2009, but he has just undergone wrist surgery and will hopefully be back before opening day. Who knows? With his wrist injuries gone will Ryan have an even greater impact with the team and rack up more than 390 at bats?
Verdict: 2010
-          Ryan handily beats 2004 Renteria and 2006 Eckstein for the better player, and a healthier Ryan will be an important contributor to the Cardinals if they are going to go all the way in 2010.
Outfield –
2004 – Reggie Sanders: .260 --- 22 --- 67 --- .315 --- 2.2
Jim Edmonds: .301 --- 42 --- 111 --- .418 --- 8.1
Larry Walker: .298 --- 17 --- 47 --- .424 --- 1.4
-          A strong outfield with a very, very strong Edmonds at the helm. Offseason and midseason pickups in Sanders and Walker added experience and strong stats to accompany the hometown hero. A combined WAR of 11.7 is also an incredibly strong number for an outfield.
            2006 – So Taguchi / (Chris Duncan): .266 --- 2 --- 31 --- .335 --- 0.3 / (.293 --- 22 ---43 --- .463 --- 2.0)
Jim Edmonds: .257 --- 19 --- 70 --- .350 --- 2.6
Juan Encarnacion: .278 --- 19 --- 79 --- .317 --- 1.2
-          The 2006 raised many questions and left much to be desired. A once immortal Edmonds posted the lowest average in the outfield, and the entire OF seemed to bring the team down. It’s amazing that every one of the outfielders managed to stay above replacement level.
            2010 – Matt Holliday: .313 --- 24 --- 109 --- .394 --- 2.7
Colby Rasmus: .251 --- 15 --- 52 --- .307 --- 2.2
Ryan Ludwick: .265 --- 22 --- 97 --- .329 --- 1.8
-          A combined WAR of 7.7 doesn’t sound as impressive as the 11.7 WAR from 2004, but in this particular instance, the stats only tell part of the story. First, including Oakland, Holliday finished the entire 2009 season with 5.7 WAR (Holliday’s WAR in 2007 was 8.0). Second, I would consider 2009 an off-year for Ryan Ludwick; he may not have a 5.7 WAR like in 2008, but he is much more capable than hitting .265. Third, Colby is just starting to blossom into a Major League ballplayer, and was able to earn the role of starting centerfielder in his first year in the Bigs. Even Matthew Leach thinks that "Colby Rasmus should be quite a bit more productive in his second season." Be patient for Rasmus, because when he overcomes the struggles of being a young, inexperienced player, he will become much more than just an above-average player.
Verdict: 2004
-          The World Series outfield of 2004 was well equipped and had few holes, thus making its way to the top of my list. I am very excited to see the 2010 outfield in action this year though, because of their enormous potential to kick Edmonds, Walker, and Sanders out of first place.


Check out Matthew Leach's take on next year's projections on the Cards' website.


Venn Diagram Comparison - http://www.flickr.com/photos/7444180@N08/3025819796/

Monday, January 18, 2010

Sportvision: "A Digitalized Sports Era"

The days of baseball as we knew it are over, and we are entering an age of digitalized sports. Remember when baseball games on the boxy television set used to look like this? Or when you had to wait for the next morning’s paper to see last night’s statistics or the standings around the league?

Well today, we are spoiled. The hotel’s channels aren’t playing your home team’s game?, then flip open your inch-thin laptop and watch it live on MLB.tv. If you’re at home, then you’re lucky and can truly become part of the game with your 1080p HD 62” flat screen, your 12 speaker surround sound, and the neighborhood shaking subwoofer. The number of stats have grown tremendously with the addition of up-to-date statistics and advanced computerized data for each baseball game, too.

One company that has helped speed up this revolution is a California based company called Sportvision. Perhaps most-widely known for their Virtual Yellow 1st Down line shown on every play of every NFL game, Sportvision has made its mark in nearly every sport, ranging from football and NASCAR, to horse racing and the Olympics.

Baseball is a sport like no other: on the outside it may seem like “…six minutes of action crammed into two-and-one-half hours.” ~Ray Fitzgerald, in Boston Glove, 1970, but to the die-hard, truly passionate baseball fan, it is 2 ½ hours of excitement and emotion. Every single play is filled with mind-numbing decisions and overwhelming athletic prowess, and for every single play there are innumerable stats that are processed. I think that for many fans, baseball is not only a game which showcases the finest athletes in all of sports, but a statistical analysis of each of these multifaceted plays and players.

Sportvision, largely affiliated with ESPN and MLB, understands this, and has created various technologies which have furthered the technical study of the world of stats.

ieeghn.org has this to say about Sportsvision, "The success of Sportvision has hinged on solving two technological problems. The first involves locating or tracking a target in real space and (crucially for live events) in real time. The second involves superimposing graphics onto that target — taking into account not only its movement, but that of the television cameras (whose lenses additionally introduce distortions). Moreover, the system has to work with several cameras simultaneously."

For example, the KZone on ESPN, developed by Sportvision, is able to show precisely where the ball entered the strike zone, accurate to 2/5 of an inch. This is done by using multiple camera sensors to create a virtual strike zone and a 3D model of the ball’s path to pinpoint the location of the pitch’s intersection with the zone. Not only can KZone show the location of a single pitch, but also has the extremely valuable ability (for which it won an Emmy Award) to show pitches in sequence in order to show how a pitcher “works” a batter.

Another one of Sportvision’s amazing technologies is PITCHf/x, a tool used on MLB Gameday. Using the camera sensors for KZone, points are plotted to create a virtual “tail” behind the ball to show what type of pitch was thrown and the exact path of the ball.

Other Sportvision innovations include personal Hit Charts, the Lead-off Line, and pregame Player Cards.
Coming Soon: FIELDf/x – FIELDf/x is a new technology which records the flight, location, trajectory and speed of the ball, and the position, route and speed of the fielder (as well as many other things) in order to determine the difficulty of the catch and compare the catch (or lack thereof) against other plays and players around the league. "The concept of being able to quantify that is appealing to teams, to the fans, and to stat heads." ~ September 19, 2009, Sam Whiting, San Francisco Chronicle. It will provide an entirely new way to contrast various players at every position and evaluate who should really win the Gold Glove awards. It will be interesting to see if Sportsvision decides to incorporate UZR (Ultimate Zone Rating) virtual imaging in the next installation of the f/x series. This new technology has already been experimented with at AT&T Park (SF Giants), and FIELDf/x is expected to hit other ballparks for the 2010 season.

There has been an amazing transition in revolutionary technology for baseball over the past 15 years, and it only seems to be accelerating to better and more advanced ways of analyzing this multifaceted game. What’s next, an Albert Pujols pick in the dirt in 3D?